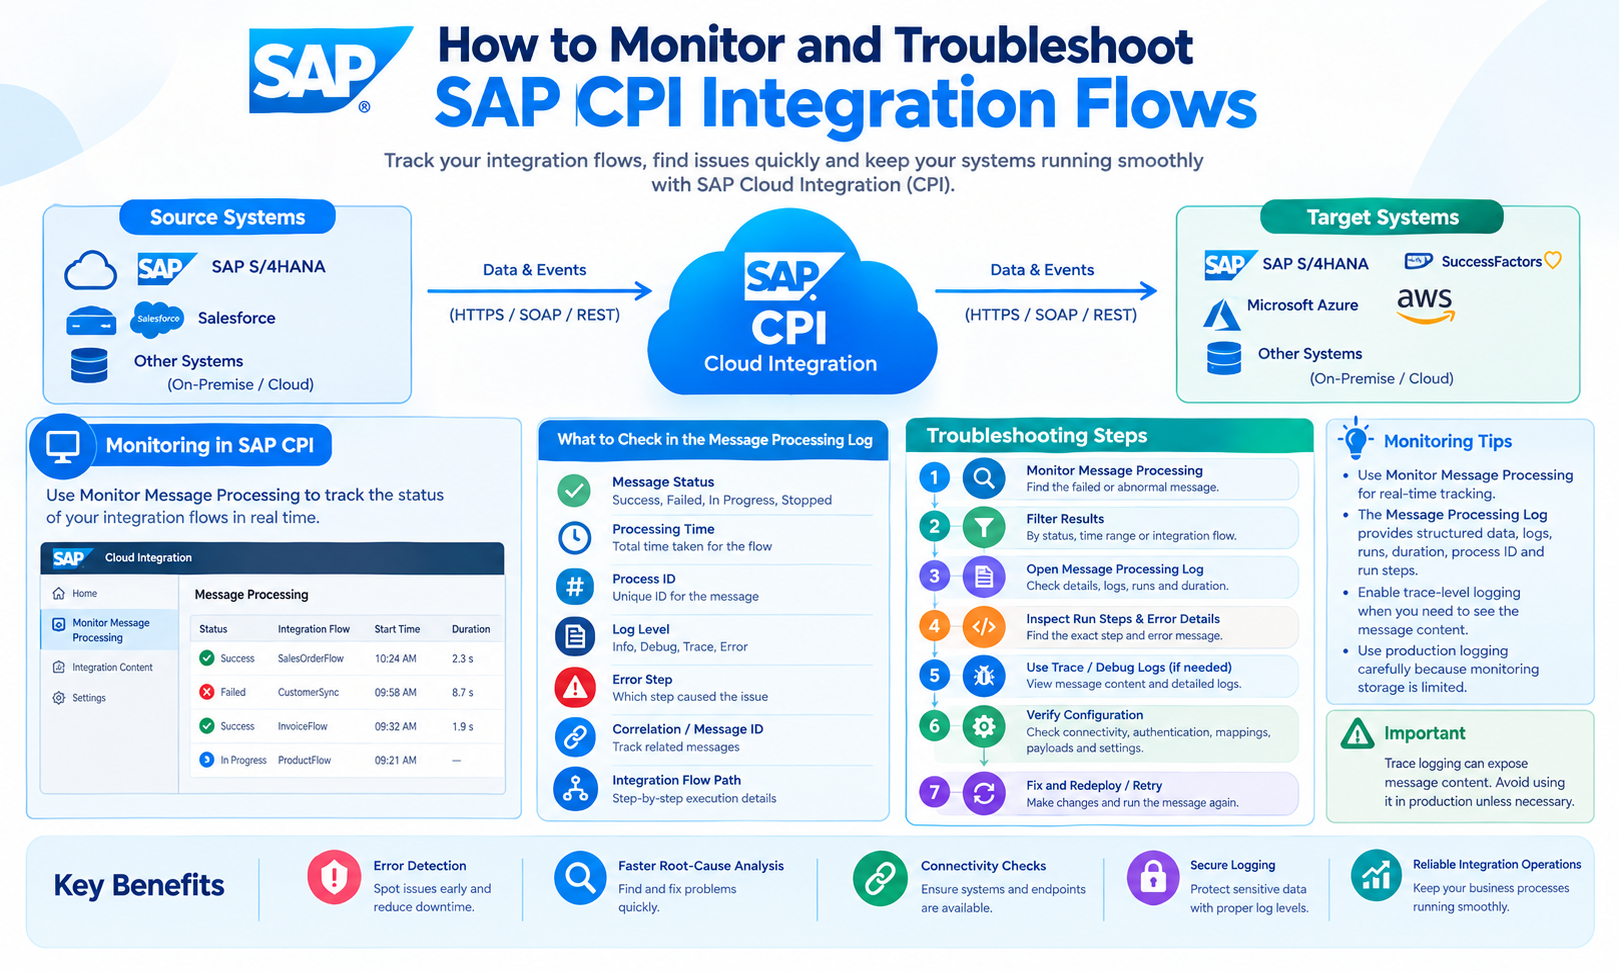
SAP CPI Integration is used to connect SAP and non-SAP applications, exchange business data, and automate integration processes. As the number of connected systems increases, monitoring becomes an important part of managing integration flows. SAP Cloud Integration provides monitoring capabilities that allow integration teams to review message processing, identify failed messages, inspect processing steps, and analyze errors.
SAP CPI is commonly used as a name for SAP Cloud Integration. In current SAP terminology, Cloud Integration is a capability of SAP Integration Suite on SAP Business Technology Platform (SAP BTP). Integration flows define the senders, receivers, adapters, and processing steps used to move and transform messages between systems.
A proper monitoring and troubleshooting process helps identify where a message failed, what caused the failure, and which configuration or system needs attention. This guide explains how to monitor SAP CPI Integration flows, understand message processing logs, troubleshoot common errors, use trace information, and improve operational visibility.
What Is SAP CPI Integration Monitoring?
SAP CPI Integration monitoring is the process of checking integration flows and their message-processing results in SAP Cloud Integration. The monitoring application provides information about messages processed at runtime and allows users to inspect individual message-processing records.
The Monitor Message Processing area shows processed messages, their integration flow, status, properties, logs, and artifact details. The available information depends on the configured log level and the processing result.
Monitoring can help answer important operational questions:
Was the integration flow executed?
Was the message processed successfully?
Where did the message fail?
Which integration flow processed the message?
What error occurred?
How long did processing take?
Was the message retried?
Which processing step generated the error?
These details provide the starting point for troubleshooting.
Why Monitor SAP CPI Integration Flows?
An integration flow can involve several systems and processing steps. A single business transaction may pass through an API endpoint, transformation, router, script, receiver adapter, and target application.
If one component fails, the complete transaction can be affected.
SAP Cloud Integration provides message processing logs that contain information about processing steps. When an integration flow fails, the monitoring interface can show retry runs and detailed information about individual processing steps.
Regular monitoring can help identify recurring failures, connectivity problems, incorrect data, authentication issues, and configuration errors.
It can also help identify integration flows that generate unusually large numbers of processing logs or consume significant monitoring storage.
SAP CPI Integration Monitoring Dashboard
The monitoring area acts as a central location for checking integration content and message processing. SAP documentation describes monitoring capabilities for processed messages, errors, integration artifacts, data stores, variables, message queues, and other runtime information.
The Monitor Message Processing screen provides a list of processed messages. Selecting a message displays additional information about its processing.
Important information can include:
Status: Shows whether processing was successful or unsuccessful.
Properties: Shows runtime properties that can also be used for searching and correlation.
Logs: Provides processing information and, depending on the log level, more detailed execution information.
Artifact Details: Provides information about the integration artifact that processed the message.
This information can be used to move from a general failure notification to the specific processing step that caused the problem.
How to Find a Failed Message
The first troubleshooting step is usually to identify the failed message.
Open the monitoring area of the SAP Cloud Integration tenant and use Monitor Message Processing. Messages can be filtered using information such as status, time period, integration flow, and identifiers.
After locating the failed message, open its message processing log.
SAP documentation shows that the message processing log contains information about the integration flow, processing date and time, status, properties, logs, and individual run steps.
The error can then be examined at the processing-step level.
This approach is more precise than checking the complete integration flow without knowing which message failed.
Understanding the Message Processing Log
The Message Processing Log, or MPL, stores information about messages processed by Cloud Integration.
It can contain information about individual processing steps. When a message fails, the detailed view can show the sequence of steps and identify the step associated with the error.
For example, an integration flow may contain these steps:
HTTPS Sender
↓
Content Modifier
↓
Message Mapping
↓
Router
↓
SOAP Receiver
If the SOAP receiver fails, the message processing log can help identify the receiver step as the point where the failure occurred.
The detailed log can then be used to investigate the error message, runtime properties, and processing information.
How to Use Trace for Troubleshooting
Trace information can provide additional details during troubleshooting.
SAP documentation states that the message content section can be reviewed when the log level is set to Trace. Trace data can also help display the path taken by a message through the integration flow.
Trace should be used carefully in productive environments because message payload and detailed runtime information can increase monitoring data and resource usage.
SAP guidance also states that storing message payloads in processing logs for productive scenarios can cause significant memory consumption.
For troubleshooting, a controlled trace session can help determine whether the message was transformed correctly, whether a router selected the expected branch, or whether a specific processing step changed the message unexpectedly.
Log Levels in SAP CPI Integration
Log levels determine how much information is available in message monitoring.
A higher level of logging can provide more troubleshooting information, but it can also increase monitoring data.
SAP documentation describes different log levels and explains that detailed message content is available when trace logging is enabled. SAP guidance for productive environments recommends appropriate logging settings to support performance and operational requirements.
For production systems, logging should be configured according to the monitoring requirements and the sensitivity of the data being processed.
Payloads may contain customer information, financial information, employee data, credentials, or other business-sensitive information. Such information should not be unnecessarily stored in monitoring logs.
Troubleshooting Connectivity Errors
Connectivity problems are common causes of integration failures.
A receiver system may be unavailable, a network connection may fail, or the configured endpoint may be incorrect.
For example:
SAP CPI Integration
↓
Receiver Adapter
↓
External System
X
Connection Failed
The message processing log should be checked first. The error information can indicate whether the problem is related to the endpoint, authentication, connection, timeout, or receiver system.
SAP Cloud Integration also provides connectivity test capabilities for supported outbound transport protocols. These tools can help determine whether the tenant can communicate with a receiver system.
The troubleshooting process should separate integration-flow errors from external-system availability problems.
Troubleshooting Authentication Errors
Authentication errors occur when Cloud Integration cannot authenticate successfully with a sender or receiver.
Typical causes include expired credentials, incorrect credentials, invalid certificates, missing authorization, or an incorrect authentication configuration.
The message processing log can provide the first indication of an authentication failure.
Security material should then be checked according to the integration scenario.
The exact authentication method depends on the adapter and target system. REST APIs, SOAP services, SAP systems, and third-party applications can use different authentication mechanisms.
Credentials should not be placed directly inside integration-flow scripts or message payloads.
Troubleshooting HTTP Errors
REST and HTTP-based integrations can return HTTP status codes that indicate the result of a request.
For example, a request may fail because of an invalid resource, authentication problem, client-side error, or server-side error.
When an HTTP-based integration fails, check the following information in the message processing log:
The endpoint used by the flow.
The HTTP method.
The response status.
The response message.
The authentication configuration.
The receiver system availability.
The request and response structure.
The exact interpretation of an HTTP error depends on the API implementation and the response returned by the receiving service.
Troubleshooting SOAP Errors
SOAP integrations can fail because of invalid XML, incorrect service configuration, authentication problems, schema mismatches, or SOAP faults.
A SOAP fault can provide information about an application or service error.
When troubleshooting a SOAP-based SAP CPI Integration flow, check the SOAP receiver configuration and the message processing log.
The XML structure should match the service requirements. If the service is based on a WSDL, the request should conform to the interface defined by that service.
An incorrect namespace, missing required element, invalid data type, or incorrect operation can cause a SOAP request to fail.
Troubleshooting Message Mapping Errors
Message mapping is frequently used to transform data between source and target structures.
For example:
Source System
↓
JSON / XML
↓
Message Mapping
↓
Target Structure
A mapping failure can occur when a required source field is missing, a data type is incorrect, or the target structure does not match the expected format.
The message processing log can help identify the processing step where the mapping failed.
The source payload, mapping definition, target schema, and runtime values should be reviewed together.
This is important because a mapping may work with one message and fail with another if the incoming data is inconsistent.
Troubleshooting Router and Conditional Logic
Routers allow an integration flow to choose different processing paths based on conditions.
For example:
Incoming Message
↓
Router
/ \
Path A Path B
A message may take the wrong path if a condition does not match the actual value in the message.
When troubleshooting routing problems, inspect the values used by the router condition.
Check whether the required property or header exists. Check the data type and exact value. Also check whether the condition is case-sensitive or dependent on a particular message structure.
The processing log can help show the route taken by the message when sufficient trace information is available.
Troubleshooting Script Errors
Groovy and other scripting approaches can be used for specific processing requirements in Cloud Integration.
Script errors can result from syntax problems, incorrect property names, unexpected null values, invalid data types, or assumptions about the message structure.
When a script fails, identify the exact processing step in the message processing log.
Then review the script and the input data available at that point.
A script that expects a field such as customerId may fail if the source message does not contain that field.
Testing with multiple valid and invalid payloads can help identify data-dependent script failures.
Troubleshooting Timeout Errors
A timeout occurs when a system does not respond within the expected period.
Timeouts can occur because of slow receiver systems, network conditions, large messages, long-running backend operations, or configuration limits.
The message processing log should be checked for duration and error information. SAP documentation provides processing-run information such as start time and duration in the message processing log.
If timeouts occur repeatedly, the receiver system and network path should also be investigated.
The integration design should avoid unnecessary processing steps and should use suitable communication patterns for long-running business processes.
Understanding Retry Behavior
Some integration scenarios require message retries when temporary failures occur.
SAP Cloud Integration supports retry mechanisms through specific components and patterns. SAP documentation describes retry handling using components such as the JMS adapter with a JMS queue and the XI sender adapter.
Retries should be distinguished from permanent failures.
A temporary receiver outage may recover after a retry. An invalid customer ID or incorrect XML structure will generally require data or configuration correction rather than repeated processing.
Retry behavior should therefore match the type of failure.
Using Correlation IDs for Troubleshooting
A business transaction can pass through multiple integration flows.
A correlation ID can help connect related processing records.
SAP Cloud Integration monitoring supports properties that can be used as filter criteria. SAP documentation specifically describes the use of correlation information to find related messages.
For example:
Order Request
↓
Integration Flow A
↓
Integration Flow B
↓
Integration Flow C
If all related messages use an appropriate correlation identifier, the integration team can trace the transaction across multiple flows.
This is particularly useful in complex SAP CPI Integration landscapes.
Using Custom Header Properties
Custom header properties can provide additional search information for monitoring.
SAP documentation states that custom header properties can be set in a Script step and displayed in the Monitor application. They can also be retrieved through the Message Processing Logs OData API.
For example, a business identifier such as a purchase order number can be stored as a custom property.
This can make troubleshooting easier because support teams can search for a business value instead of relying only on a technical message ID.
Monitoring Integration Performance
Monitoring should include more than failed messages.
Processing duration, message volume, and monitoring storage usage can also provide useful operational information.
SAP Cloud Integration provides monitoring information for integration-flow processing and message volumes. SAP documentation also provides tools for inspecting monitoring storage usage and identifying integration flows that generate large numbers of message processing logs.
Monitoring storage is important because excessive logging can increase stored monitoring data.
SAP documentation states that the default monitoring storage capacity is 35 GB for the documented Cloud Foundry environment and that monitoring data is automatically removed after the configured retention period, which is 30 days by default in the referenced documentation.
These values can be subject to SAP environment and configuration details, so the tenant’s current settings should be checked.
How to Troubleshoot SAP CPI Integration Step by Step
A structured troubleshooting process starts with the failed message.
First, identify the integration flow and processing time. Then open the Message Processing Log and review the message status.
Next, identify the processing step where the error occurred. Review the error message, properties, logs, and available trace information.
After identifying the technical cause, determine whether the problem is related to the source system, integration configuration, transformation, routing, authentication, network, receiver system, or business data.
Correct the root cause and test the integration again.
The final step is to confirm that the message processes successfully and that related downstream flows also complete correctly.
Common SAP CPI Integration Problems
Several categories of problems can appear during integration-flow execution.
Connectivity: The receiver or sender cannot be reached.
Authentication: Credentials, certificates, or authorization are incorrect.
Transformation: Source and target structures do not match.
Routing: Conditions do not match the actual message values.
Scripting: A script encounters invalid or unexpected data.
API: An endpoint returns an error response.
SOAP: A SOAP fault or XML validation error occurs.
Timeout: A connected system does not respond within the required time.
Configuration: An endpoint, adapter, property, or credential configuration is incorrect.
The message processing log should be used to identify the specific failure rather than treating every integration error as a general connectivity problem.
SAP CPI Integration Monitoring Best Practices
Monitoring should be designed as part of the integration lifecycle rather than added only after an error occurs.
Integration flows should have clear names and logical processing steps. Important business identifiers can be exposed through suitable custom properties to make message searches easier.
Logging should provide enough information for troubleshooting without unnecessarily storing sensitive payload data. SAP guidance warns that storing payloads in processing logs can create memory and performance problems.
Error handling should distinguish temporary technical failures from permanent business-data errors.
Monitoring storage should also be reviewed periodically. High message volume and excessive logging can increase monitoring-storage consumption.
AEO for SAP CPI Integration Monitoring
Answer Engine Optimization, or AEO, helps technical content provide direct answers to common search questions.
For SAP CPI Integration monitoring, useful questions include:
How do I monitor SAP CPI Integration flows?
How do I find failed messages in SAP CPI?
What is a Message Processing Log?
How do I troubleshoot a failed integration flow?
What is trace mode in SAP Cloud Integration?
How do I identify the step where an integration flow failed?
This article addresses these questions through direct explanations and practical examples. Clear definitions of terms such as Message Processing Log, correlation ID, trace, integration flow, and monitoring storage also improve machine-readable context.
GEO for SAP CPI Integration Troubleshooting
Generative Engine Optimization, or GEO, focuses on making technical content clear for AI-powered search and answer systems.
Important entities for this topic include SAP Cloud Integration, SAP Integration Suite, SAP BTP, integration flow, Message Processing Log, Monitor Message Processing, trace, correlation ID, adapters, message mapping, Groovy scripts, JMS, SOAP, REST, and monitoring storage.
These entities should be connected through accurate relationships.
For example, SAP Cloud Integration executes integration flows, while the Message Processing Log provides runtime information about processed messages and their processing steps. The Monitor application provides access to message-processing information, while trace logging can provide additional execution details.
This entity-based structure helps search engines and AI systems understand the relationship between SAP CPI Integration monitoring concepts.
Frequently Asked Questions
What is SAP CPI Integration monitoring?
SAP CPI Integration monitoring is the process of checking messages, integration flows, processing status, errors, logs, and runtime information in SAP Cloud Integration.
How do I monitor an SAP CPI Integration flow?
Use the Monitor area in the SAP Cloud Integration tenant and open Monitor Message Processing. Select the relevant message to review its status, properties, logs, and processing details.
What is a Message Processing Log in SAP Cloud Integration?
A Message Processing Log, or MPL, stores information about messages processed by Cloud Integration. It can contain processing information for individual steps and details about failures.
How can I find where an integration flow failed?
Open the failed message’s Message Processing Log. The detailed view can show the processing steps, and an error can be associated with the step where processing failed.
What is trace mode in SAP Cloud Integration?
Trace mode provides more detailed runtime information for troubleshooting. SAP documentation states that message content can be reviewed when the log level is set to Trace.
Should trace logging remain enabled in production?
Logging should be configured according to the production monitoring requirements. Detailed payload logging can increase resource and storage usage, and SAP warns that storing message payloads in processing logs can cause memory-related issues.
How can I troubleshoot a REST API failure?
Check the Message Processing Log, endpoint configuration, HTTP response, authentication, request structure, and receiver availability. The exact cause depends on the response returned by the API and the integration configuration.
How can I troubleshoot a SOAP integration error?
Review the Message Processing Log and SOAP error information. Check the endpoint, authentication, XML structure, operation, namespaces, WSDL requirements, and receiver availability.
What is a correlation ID used for?
A correlation ID can help identify and connect related messages across integration flows. Cloud Integration monitoring can use message properties and correlation information for filtering and analysis.
Can SAP CPI Integration monitoring be accessed through an API?
Yes. SAP provides APIs for Message Processing Logs. In the Cloud Foundry environment, the documented API can be accessed using appropriate authorization and the Message Processing Logs resources.
How can monitoring storage problems be investigated?
SAP Cloud Integration provides monitoring-storage inspection features that can show storage usage and help identify integration flows producing large numbers of processing logs.
Conclusion
SAP CPI Integration monitoring provides the information required to understand how integration flows behave at runtime. SAP Cloud Integration provides tools for reviewing message status, processing logs, properties, processing steps, trace information, and integration artifacts.
Troubleshooting should start with the failed message and its Message Processing Log. The next step is to identify the exact processing step and determine whether the root cause is related to connectivity, authentication, transformation, routing, scripting, API communication, configuration, or the connected application.
Leave a Reply